This is the story of a graph that looked like a cliff, a week that felt like a regression, and a tiny UI detail in Google Search Console that turned panic into perspective. If you have ever watched a traffic line go vertical in the wrong direction, you already know the feeling: your stomach drops before your brain catches up.Also read:Fix “Sitemap Couldn't Fetch” in Next.jsI am not selling SEO courses. I am a developer who ships things and then stares at charts to see if the work landed. When Search Console implied the floor had fallen out after months of growth, my first instinct was the same as a production incident: something is catastrophically wrong. What actually happened was more boring than that—and worth writing down.
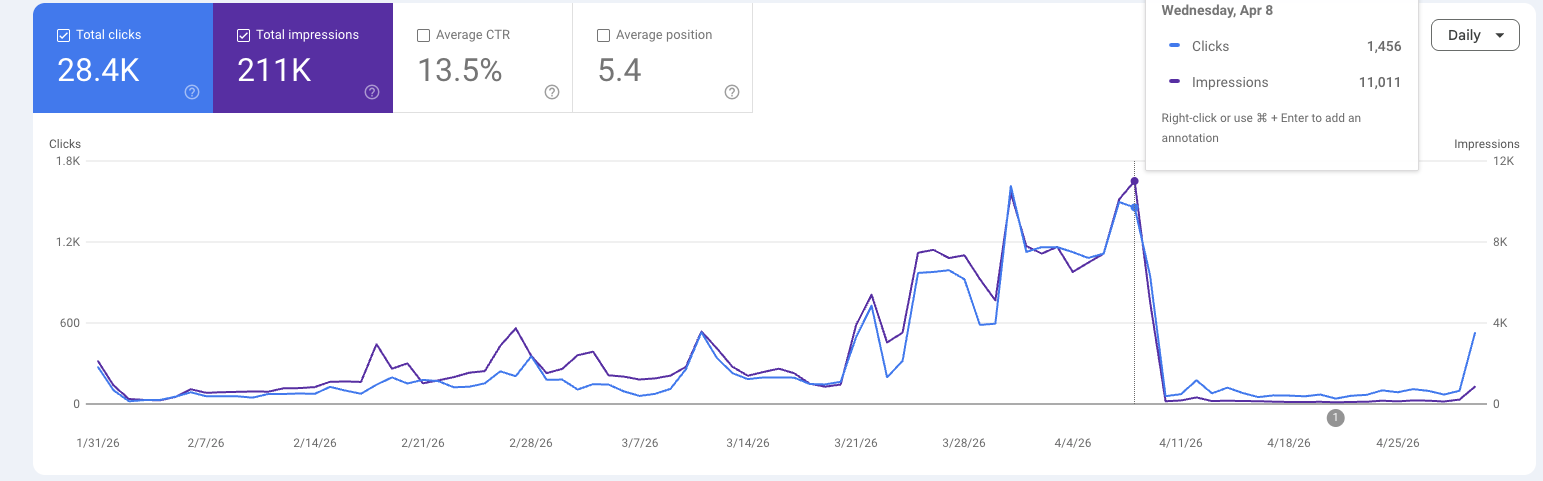
Around January 2026, the line started moving the slow way: more queries, more impressions, more clicks. Nothing viral—just the kind of compounding that only looks obvious when you zoom out.By late March and early April, the curve had a personality. On strong days the property cleared over 1,000 daily clicks and over 10,000 daily impressions. The performance report stopped feeling like a side project and started feeling like a system I could trust.That phase is dangerous in a good way. You start believing the dashboard.
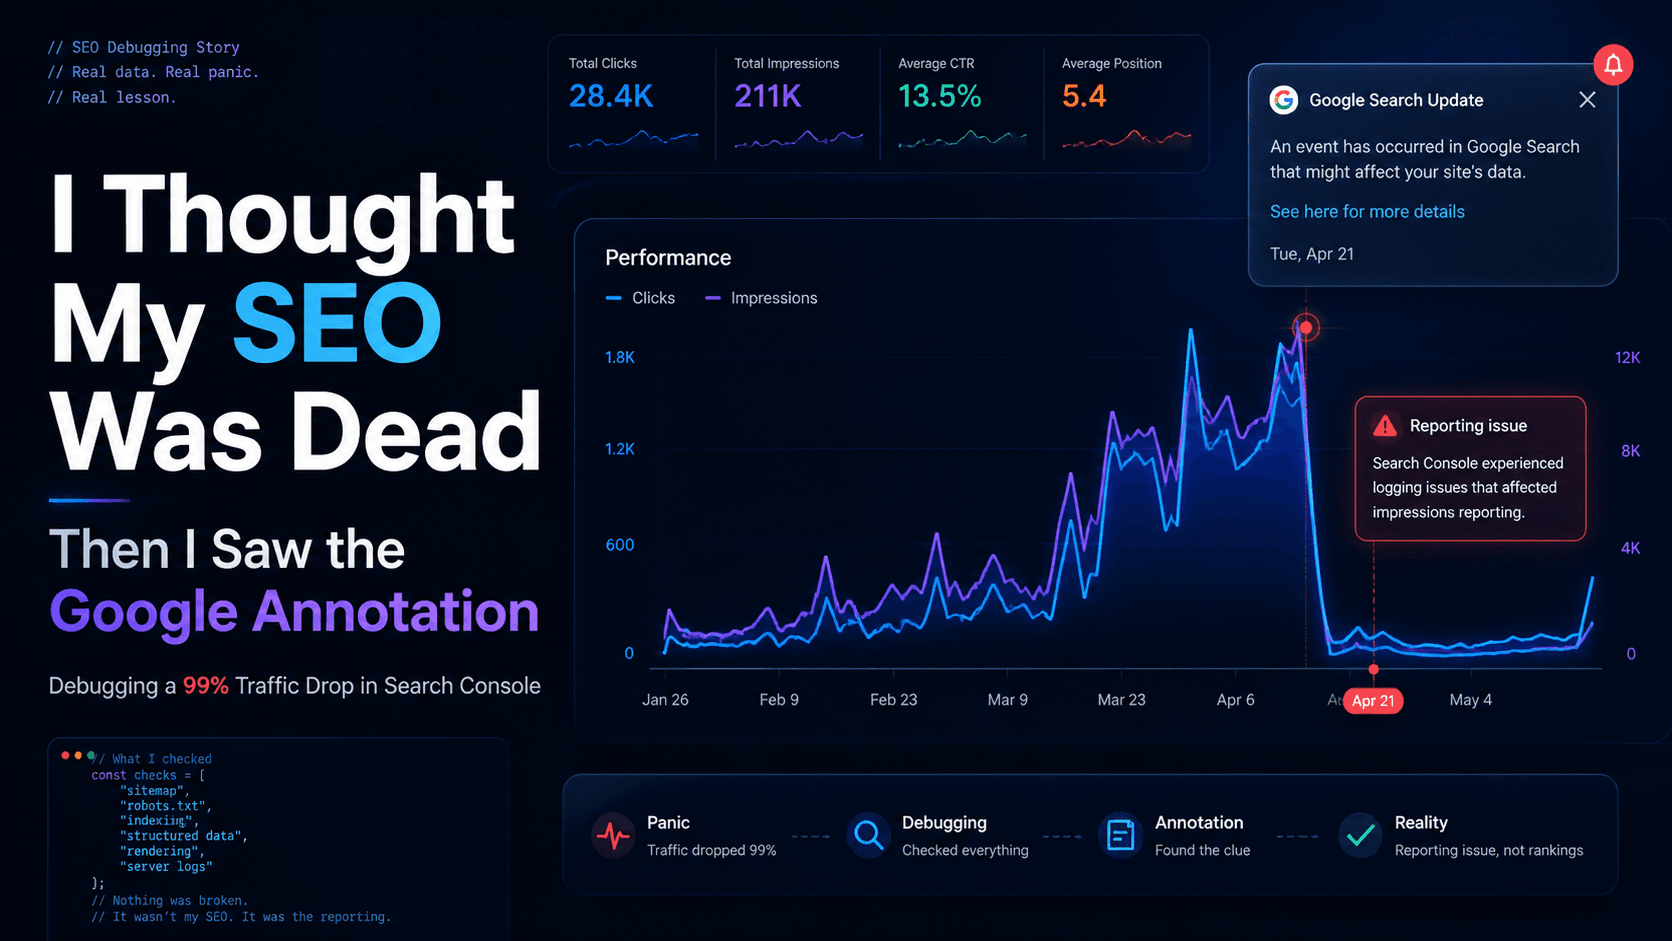
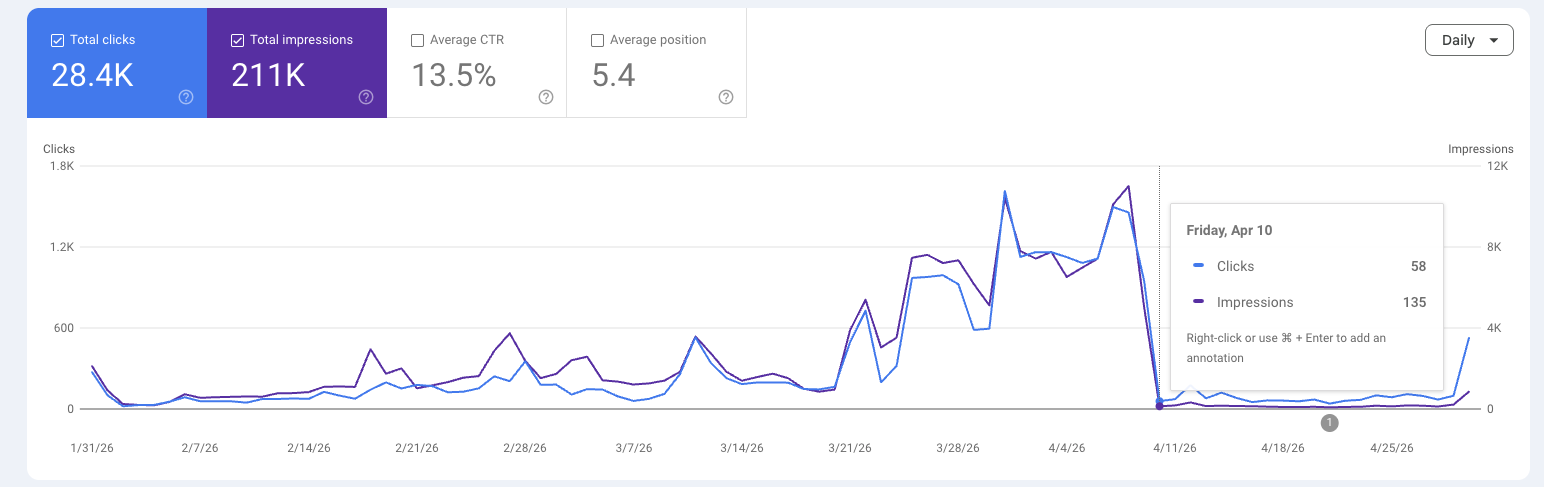
Then it changed.Impressions dropped by almost 99%.Clicks collapsed overnight. The chart did not slope down—it looked broken, like half the series had been deleted.The strange part was that nothing on the site itself looked obviously broken.If you have never lived through it, it is hard to describe how personal a chart can feel when it contradicts what you think you know about your site. The scary explanations feel proportional because the visual is proportional.
Traffic collapsed almost overnight after weeks of steady growth.
I did not open Search Console and reach for a calm checklist. I reached for the worst story and tried to brute-force disprove it:
Maybe a core update.
Maybe indexing broke.
Maybe the sitemap regressed.
Maybe something technical torched rankings.
None of that was crazy—it was just early. The real mistake was treating a dashboard collapse as proof of a ranking collapse before I had evidence either way.
Once the adrenaline dipped, I went back to being an engineer. I did not start from “Google is wrong”—that is lazy too.I walked the boring list: sitemap still sane and submitted, robots.txt not blocking something dumb, indexing still passing the sanity checks I know how to run, hosting without an obvious outage aligned to the date, structured data and rendering without a new smoking gun, and then every Search Console tab that looked like it might whisper a reason.The familiar trap showed up again: everything looked fine while the graph looked catastrophic. That mismatch is where people spiral.Different failure mode, same product: I spent months on “Sitemap Couldn't Fetch” in Next.js—same blunt UI, different root cause. This time the URL story was not the villain.
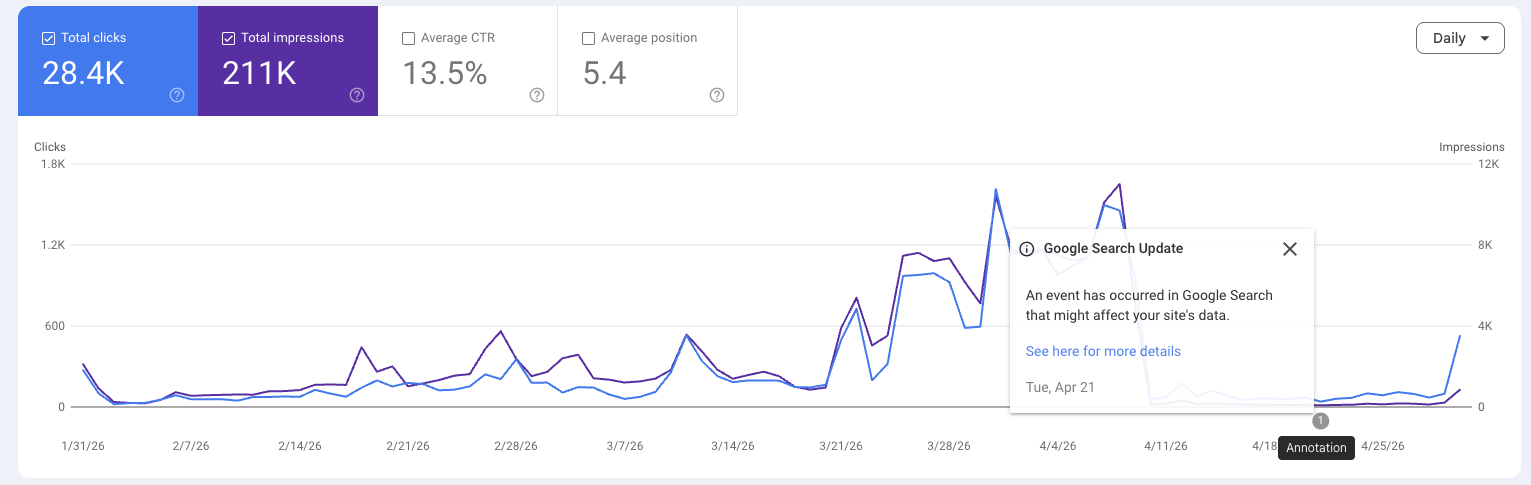
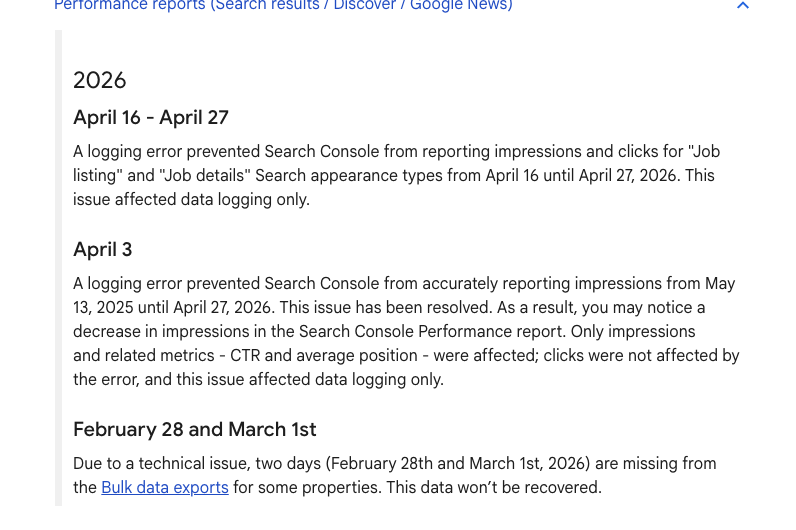
Later than I would like to admit, I noticed something easy to miss when you are zoomed into your own panic: a small annotation on the Search Console timeline—an in-product note tied to a date, pointing at an event worth reading.Not a forum thread. Not a hot take. A Google annotation that reframed the whole week in one click.
The note I had been treating as decoration.I eventually dug into Google’s documentation on performance reports in Search Console—the section that covers how Search results data is built and when annotations flag logging or processing hiccups. That page did not fix my chart, but it confirmed I was asking the right kind of question: not only “did rankings die?” but also “is this window of data trustworthy?”Google later confirmed, in the product surface I was staring at anyway, that reporting data had been affected by a logging issue—the kind of sentence that turns a horror movie back into an incident report.
Plain language, attached to the same graph that scared me.
Here is the skill I wish I had used on day one.Ranking problems (oversimplified) usually leave breadcrumbs you can chase: query movement, URL-level shifts, deploys, relevance changes. A perfect vertical cliff across everything is possible, but it is not the first hypothesis I would bet a rewrite on.Reporting problems can look like someone deleted your visibility because the measurement pipeline hiccuped. The site can be fine. The URLs can be fine. The graph is what is wrong—for that window.
Sometimes your SEO is not broken — the reporting is.
That is not a slogan. It is a reminder to separate “the metric moved” from “the world moved” before you ship irreversible changes.
I did not learn a hack. I learned the same lesson monitoring teaches when a metric goes impossible: do not let the exporter write the postmortem before you read the notes.Search Console deserves that courtesy too. If you are staring at a cliff tonight: breathe, read the small text on the chart, open the official docs once, run your checklist, then decide what is actually broken.That week felt terrible while I was inside it. Looking back, the chart taught me more about debugging than SEO.
FAQ
Practical notes—short on purpose.
Can Google Search Console data be inaccurate?
Yes. It is aggregated reporting: it can lag, get revised, or wobble when logging and processing hit a snag. Treat anomalies as something to explain, not as raw truth.
Do impression drops always mean ranking drops?
No. A cliff can be real visibility loss or a bad window of instrumentation. Investigate both hypotheses before you burn the site down.
What are Search Console annotations?
Timeline notes that flag relevant events—updates, known issues, reporting caveats. They exist so a weird shape on the chart has context.
How should I investigate sudden SEO traffic drops?
Note the date range, read any annotation, run a tight technical checklist, then use official docs to see whether reporting could explain what you are seeing before you change strategy.
Can reporting issues affect clicks and impressions?
Yes. When the pipeline that records impressions or clicks hiccups, both lines can move together in ways that feel like a ranking disaster.
Should I panic after a sudden traffic collapse?
Feel what you feel—then switch modes. Calm triage almost always beats a week of reactive edits.