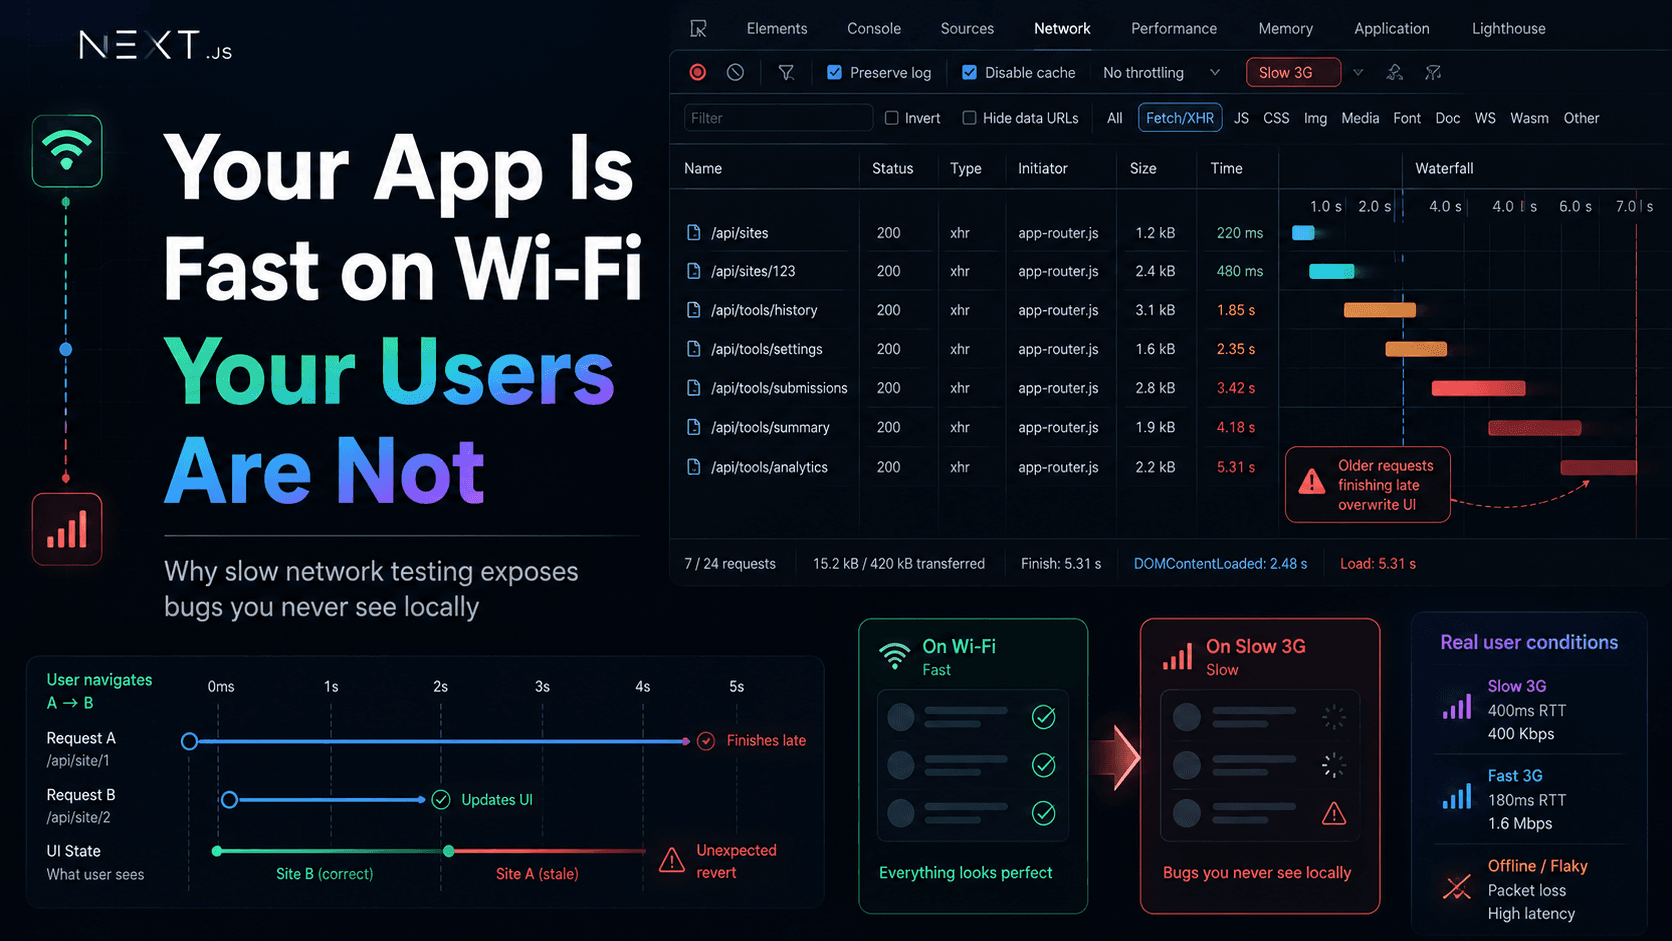
This is a production debugging story from a Next.js App Router dashboard: fast on my desk, confusing in the wild, and only honest when I stopped trusting Wi-Fi.The app felt fine locally. QA passed on office Wi-Fi. Users on slower networks still saw wrong tabs, stale lists, and loading states that looked “done” while the UI was lying. None of that showed up in a casual Lighthouse run. It showed up when I slowed the network on purpose and watched requests finish in the wrong order.This is not a Chrome DevTools tutorial. It is a note about frontend correctness under latency—and why “fast locally” is a weak signal.
On localhost with fiber Wi-Fi, the story is always the same:
API calls return in tens of milliseconds
Overlapping requests rarely overlap long enough to matter
loading flips to false before you can blink
Client navigations feel instant because the network keeps up
So you ship. The code “works.” The loading spinner behaves. The Network tab looks like a neat staircase—start, finish, start, finish—in the order you imagined.Fast local development environments hide bugs that appear immediately under real latency. That sentence stopped being theory the week production tickets mentioned “sometimes the wrong site loads” and I could not reproduce it by clicking slowly at my desk.
User opens workspace A, switches to B quickly—B flashes, then A’s data returns
Filters change; the list briefly matches, then snaps back to an older filter
Loading states looked correct locally; in the field, the screen settled on stale content
The bug only appeared during fast navigation—slow QA walks missed it entirely
My first wrong turns were familiar: more memoization, more debouncing, another isLoading flag. Debouncing reduced noise. It did not fix ordering. Older requests still completed. They still called setState if nothing told them to stop.Production added variance: mobile networks, VPNs, colder API paths, regions farther from the database. I had already written about moving Vercel functions closer to MongoDB when latency was honest infrastructure. This bug was different—it was client timing, not round-trip geography alone.
The breakthrough was not a new library. It was DevTools → Network, reproduce with fast clicks, and read the waterfall.Request 1 starts (site A). Request 2 starts (site B). Request 2 finishes first—the UI looks correct. Request 1 finishes later—the UI regresses. The timeline does not care which request you intended. It only reports what completed.That is when “everything looked fine on localhost” became a concrete lie: requests finished in a different order than the user’s last action. Latency exposed assumptions my code never enforced.
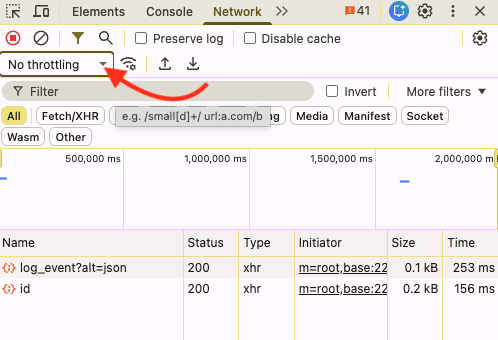
The easiest way to reproduce hidden async bugs was enabling throttling directly in Chrome DevTools.Throttling is not punishment for your app. It is a timing microscope. You are not asking “is my app bad on Slow 3G?” You are asking “what happens when completion order is no longer guaranteed?”
Requests that would overlap on a phone serialize on your laptop
Race windows shrink to milliseconds—easy to miss with human-speed clicking
Wi-Fi masked timing problems. QA on the same fast network reinforced false confidence. Production users were not wrong; my reproduction environment was incomplete.
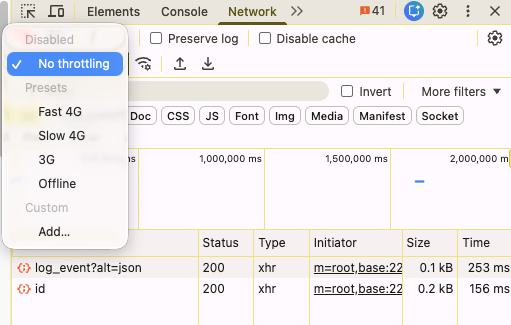
Fast local Wi-Fi hid problems that immediately appeared under slower network conditions.Open the throttling dropdown in the Network panel. Slow 4G is often enough to widen overlap without turning the session into torture. Slow 3G is harsher—useful when you need the bug to scream. You are simulating latency and bandwidth constraints, not “bad engineering.” Real users live in variable conditions; your job is to see how the client behaves when responses do not arrive in lockstep.
With throttling on, the same clicks produced a different story:
Two fetch calls in flight for different websiteId values
The olderwebsiteId finished last and overwrote state
Spinners dropped while the wrong payload was already painted
The network timeline explained the issue in a way React DevTools never did
Mental model on fast Wi-Fi:
File
text
start A → finish A → start B → finish B
What production (and Slow 3G) often look like:
File
text
start A → start B → finish B → finish A ← stale wins
That is a race condition: outcome depends on timing, not user intent. App Router makes fast transitions normal—soft navigation feels instant; the network does not. Client-side routing does not wait for your previous request to retire politely.
Async code rarely guarantees order. await orders statements in one function; it does not order two separate effects fired by two route changes.In my dashboard, workspace pages load in client islands: history, settings, submit. Users hop between sites from a list. Each hop changes websiteId and triggers a fetch. Slow navigation hides the bug because request n finishes before n+1 starts. Fast navigation overlaps them—and throttling makes overlap the default.
// Anti-pattern: last response wins, not last intent
useEffect(()=>{
let cancelled =false;
asyncfunctionload(){
setLoading(true);
const res =awaitfetch(`/api/workspace/${websiteId}`);
const data =await res.json();
if(!cancelled){
setRows(data.rows);
setLoading(false);
}
}
load();
return()=>{
cancelled =false;// bug: should be true — stale responses still apply
};
},[websiteId]);
Under Slow 3G, flip websiteId three times quickly. Watch three bars in Network. If cleanup does not abort or ignore stale generations, the slowest response wins—often the first one you no longer care about.
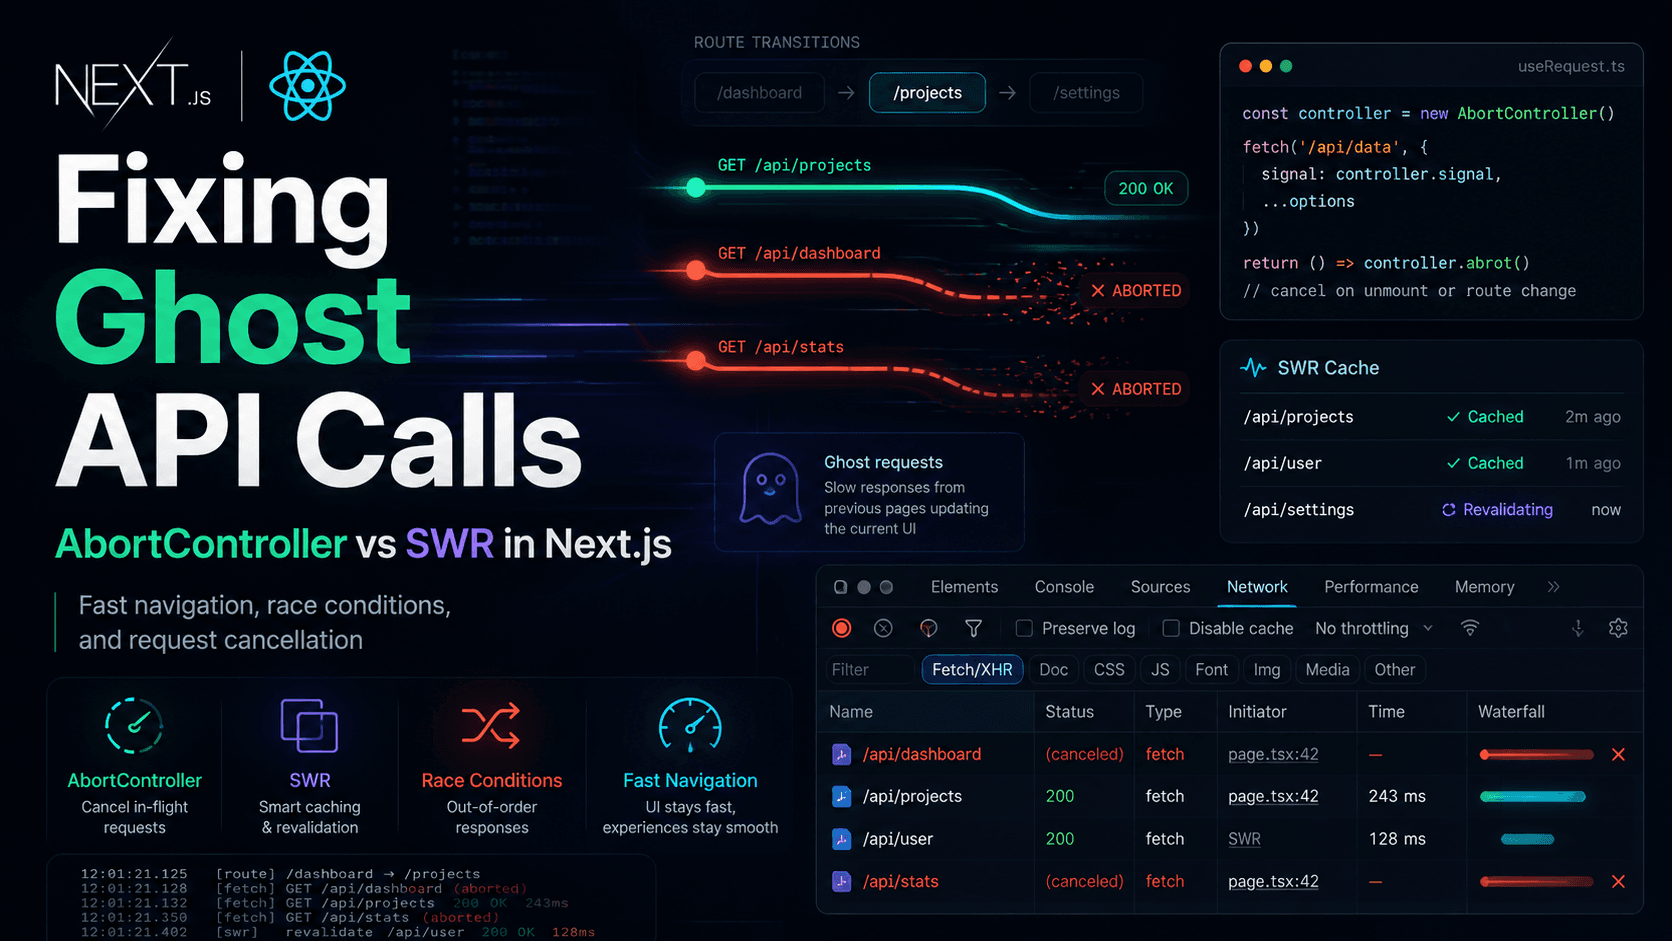
Generation counter—ignore responses when id !== latestId
Data library keyed by full context (SWR/React Query) so updates scope to the active key
I went deeper on cancellation and SWR in a separate write-up when ghost requests became the main incident shape. The lesson here is earlier: latency makes the wrong winner visible.
A spinner is not proof of correctness. It only means something is in flight—or you set loading true at the start and false when any response returns.Common illusions:
setLoading(false) in finally while stale data is already on screen
Showing previous data with keepPreviousData while a new key loads—fine when intentional, deadly when keys bleed
The loading state lied: spinner gone, wrong content visible, newer request still running
Under throttling, hold the spinner until you know which request you are honoring—or show an explicit empty state for the new key. A short honest loading beat beats a confident wrong screen.
App Router encourages snappy UX: layouts persist, segments swap, client components refetch on new params. Users click faster than requests finish. That is not misuse; it is normal.Repro workflow that actually worked for me:
Open DevTools → Network → enable Slow 4G (or Slow 3G if needed)
Open the waterfall view; disable cache while debugging if it confuses the story
Perform the fastest user path: list → detail → list → different detail within two seconds
Sort by finish time, not start time
Note which response last touched React state—that is your bug
Fast navigation plus slow network is the combination that turned “random UI” into a repeatable lab experiment.
Treat throttling as part of debugging, not a one-off stunt:
Step
What to do
Baseline
Reproduce on fast network; confirm you understand the happy path
Throttle
Slow 4G first; escalate to Slow 3G if overlap is still tight
Overlap
Change route params or filters faster than requests complete
Timeline
Read finish order; map each response to a setState or SWR mutate
Fix
Abort, ignore stale generation, or key data by full context
Verify
Repeat with throttling on; then spot-check on fast network
Request waterfall debugging means following dependencies: layout fetch, client island fetch, prefetch, analytics—bars that stack and finish out of order. A parent that resolves after a child can still poison shared client state if both write to the same store.
Click a slow request → Timing tab. Compare Waiting (TTFB) vs Content Download. A long TTFB with a fast download still means your UI sat in “loading” while the server thought. Pair that with which fetch handler ran last in your code—timestamps on the server do not protect client state.
Server Components can make the first paint feel “done” while client islands still race. A fast shell does not mean client fetches are ordered. When debugging, separate:
Server-rendered data (stable on navigation if cached correctly)
ClientuseEffect / SWR fetches (vulnerable to overlap)
Does App Router make timing bugs easier to notice? It makes fast transitions normal, which increases overlap. The framework is not broken; your async contract has to match snappy navigation.
Fast locally is not a reliable signal of correct under latency. Wi-Fi and localhost compress race windows until they disappear. Production and throttling widen those windows until incorrect setState is obvious.When the UI looks random, assume ordering, not mysticism. Ask which response last touched state. Ask whether latest user intent is enforced. The Network tab is unforgiving. That is why it became the most important tool in this incident—not Lighthouse scores, not another wrapper library.I was debugging timing, not throughput. Once finish order was part of the contract, the bugs stopped feeling random—and production stopped surprising me.Also read:Fixing Ghost API Calls in Next.js · Why I Stopped Using Axios in Next.js App Router · How to Change the Vercel Server Region for Next.js · Fix “Sitemap Couldn't Fetch” in Next.js · Blog home
FAQ
Practical questions about slow network testing and frontend timing
Why should developers test with Slow 3G?
Not to score points on harsh networks—to widen race windows so overlapping requests finish out of order. That reveals stale responses, wrong setState, and missing abort logic that fast Wi-Fi hides.
Does local Wi-Fi hide frontend bugs?
Often, yes. Low latency shrinks overlap between requests. Bugs tied to completion order may never appear until throttling, mobile networks, or fast client navigation in production.
Can race conditions appear only in production?
They can appear anywhere timing varies. Production adds latency variance; local fast networks make races rare. The logic bug is usually already in the code—production timing exposes it.
What is request waterfall debugging?
Reading the Network panel timeline: which requests start, which block others, and finish order versus user actions. When finish order disagrees with last intent, you have a sequencing bug.
Why do loading states sometimes lie?
loading often tracks “a request started” or “one request ended,” not “the data on screen matches the latest user action.” Stale payloads can render while a newer request is still in flight—or after an older one wins last.
Does App Router make timing bugs easier to notice?
It encourages fast client transitions and mixed server/client data. Races are not new, but snappy navigation increases overlapping fetches unless you abort, key data correctly, or ignore stale generations.
Should slow network testing be part of QA?
Yes—as a repro tool for async correctness, alongside fast-click paths. It is not a replacement for functional tests; it catches classes of bugs happy-path QA on office Wi-Fi misses.
What does throttling actually simulate?
Chrome applies latency and bandwidth limits to network requests so waterfalls stretch and overlap. It approximates constrained mobile or congested links—not every real-world condition, but enough to surface ordering bugs.